
Background
I wanted to re-implement my CloudWatch dashboard on my Raspberry Pi, but I wanted to make it more extensible and easier to work with. I decided to write a Python module that could display multiple widgets on the framebuffer, and I could easily add new widgets as needed using the plethora of Python libraries available.
Notes
Although this was written for a Raspberry Pi, it should work on any Linux system with a framebuffer. The Raspberry Pi is a great choice because it’s cheap, low-power, and has built-in HDMI port(s). This makes it easy to connect to a TV or monitor and display the dashboard.
Each widget has a configurable refresh rate, and refreshes occur in the background on separate threads. This allows for multiple widgets to update concurrently, and the main thread can focus on rendering the latest output to the framebuffer.
Currently Implemented Widgets
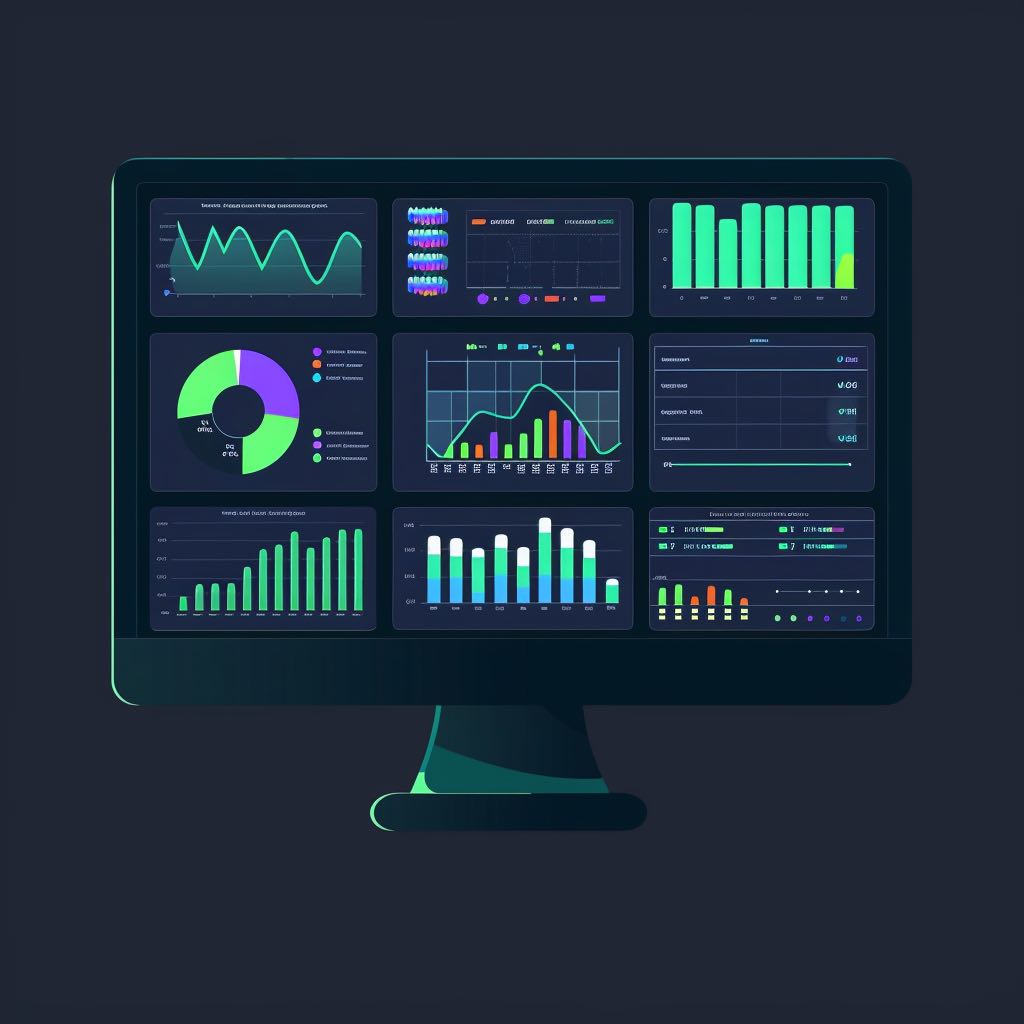
- CloudWatch Dashboards via Image API
- Images from the web - support arbitrary images, like security cams, etc.
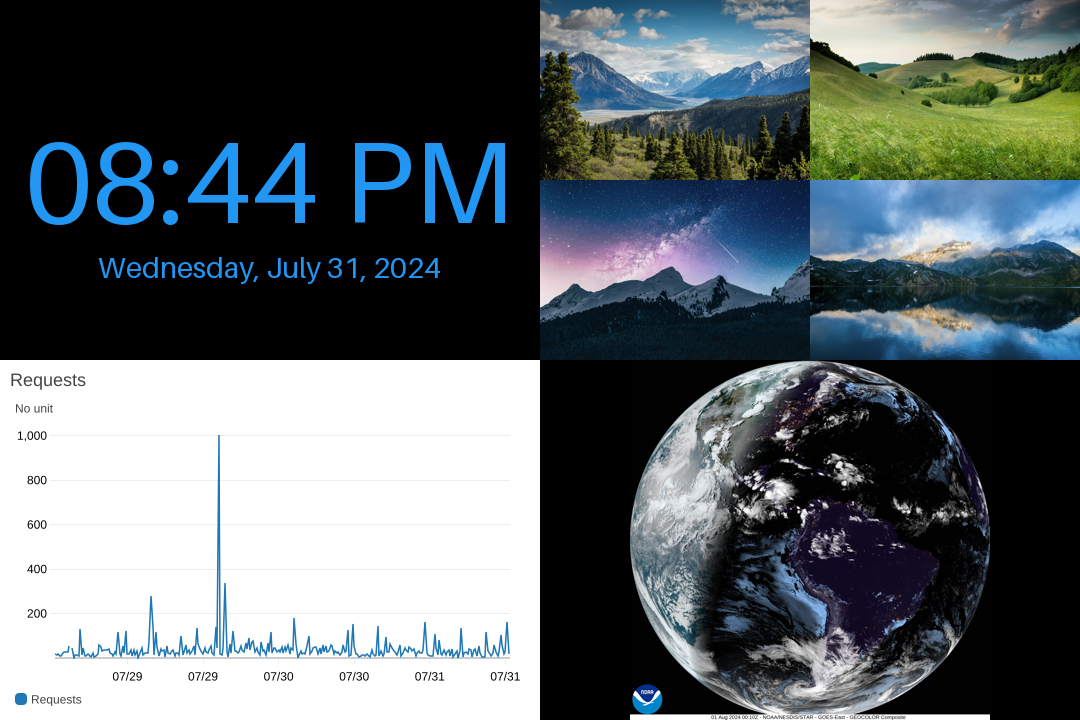
- Clock - a simple clock widget, with date and time, and an optional timezone
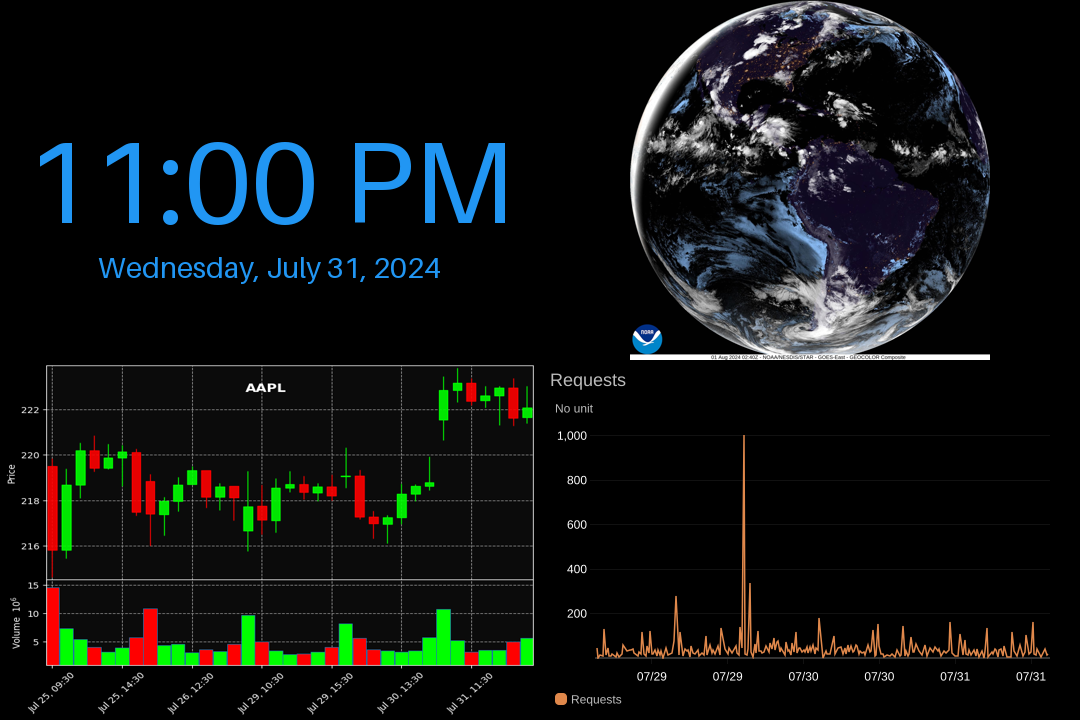
- Stock Prices Chart - a candlestick chart of a stock symbol
- Text - static text - mainly an example for future widgets
- Satellite Tracking - plot the location of a satellite (e.g. the Space Station)
Final Result
Here’s some things you could do with it:
Prerequisites
Add user to video group
We won’t run the main script as root, so we add the user to the video group to access the framebuffer.
usermod -aG video "$USER"Python requirements
If desired, run this in a virtualenv.
pip3 install -r requirements.txtPillow dependencies
If not installed, you will likely need libopenjp2-7 for the Pillow library to work. I ran into this error: ImportError: libopenjp2.so.7: cannot open shared object file: No such file or directory, which we can solve by running:
sudo apt-get install libopenjp2-7Switch to Graphics Mode
I originally integrated this into the main program but that’d require us to call it as root. Instead, I separated the script and we can run this as root to set the graphics mode. This functions by calling ioctl on the framebuffer device to set the graphics mode, which is a privileged operation.
This has the same effect as tools like tput civis and tput cnorm terminal, but can be run outside of the tty that it affects.
sudo python3 gfxmode.py /dev/tty1 graphicsSince we’re downloading images from the internet and loading with PIL, I figured running the whole thing as root (or trying to drop permissions) would be more trouble than it’s worth so this portion is separate.
The Code
I published the code here: https://github.com/richinfante/fb-dashboard, which you can clone and run on your Raspberry Pi.
Copy the examples/example1.toml to be named config.toml, and customize the file to your liking. This is where you specify the widgets you want to display, their position, etc.
Configuration
CloudWatch Dashboards
This is an example config. The widget key is the JSON representation of the widget from the CloudWatch dashboard. You can get this by clicking the “Source” tab in the widget editor, and setting the type to “Image API”. Remove all newlines and it should work.
If you replace the hardcoded width and height values in the JSON with w and h, the image will auto-size to the widget bounds. This is optional if you want to stretch or scale the image.
[widgets.my_cloudwatch_metric]
x = '0'
y = '0'
w = 'w / 2'
h = 'h / 2'
type = 'CloudWatchMetricImage'
aws_profile = 'default'
aws_region = 'us-east-1'
widget = '{"metrics": [[ "AWS/CloudFront", "Requests", "Region", "Global", "DistributionId", "YOUR_DISTRIBUTION_ID" ]],"view": "timeSeries","stacked": false,"stat": "Sum","period": 900, "width": w, "height": h,"start": "-PT72H", "end": "P0D", "timezone": "-0400"}'
Images from the web
You can pull images from the via an HTTP request as well. This is an example of pulling an image from Unsplash. The path key is the URL of the image you want to display.
[widgets.unsplash_image]
x = 'w / 2'
y = 'h / 2'
w = 'w / 2'
h = 'h / 2'
type = 'Image'
path = 'https://images.unsplash.com/photo-1532522750741-628fde798c73?w=1600&auto=format&fit=crop&q=60&ixlib=rb-4.0.3&ixid=M3wxMjA3fDB8MHxzZWFyY2h8MTB8fGhhY2tlcnxlbnwwfHwwfHx8MA%3D%3D'
IP Cameras
Although it won’t give a real-time feed, you can pull images from security cameras as well. This is an example of pulling an image from an Amcrest camera.
Since Amcrest cameras use digest auth, you’ll need to specify the auth_type, username, and password keys. If your camera uses basic auth, you can omit the auth_type key.
[widgets.security_cam]
x = 'w / 2'
y = '0'
w = 'w / 2'
h = 'h / 2'
type = 'Image'
path = 'http://192.168.1.123/cgi-bin/snapshot.cgi'
# NOTE: `digest` is the auth type for Amcrest cameras, you may need to change this to `basic`, or omit credentials entirely
auth_type='digest'
username='camera_username'
password='camera_pass'
Clock
Here’s an example of a clock widget config. Customize the position, colors, and timezone to your liking.
[widgets.clock]
x = '0'
y = '0'
w = 'w / 2'
h = 'h / 2'
type = 'Clock'
clock_format = '%I:%M %p'
date_format = '%A, %B %d, %Y'
bg_color = '#000000'
fg_color = '#2196F3'
timezone = 'America/New_York'
Stocks
[widgets.apple_stock]
x = '0'
y = 'h / 2'
w = 'w / 2'
h = 'h / 2'
type = 'StockMarketCandlestick'
# Apple stock
symbol = 'AAPL'
time_period = '5d'
interval = '1h'
refresh_interval = '600'
# plot_style = 'nightclouds'
show_volume = true
Running the dashboard
To test your configuration, you can run it manually. To run it on an unsupported system and get a PNG file instead of writing to the framebuffer, you can pass the --no-framebuffer flag.
cd into the cloned repo and run the following command:
python3 -m fb_dashboardRun at boot
On Raspberry Pi, /etc/rc.local is a pretty easy place to run scripts at boot. Add this line before exit 0:
You will likely need to change the username and path to the cloned repo. This will run the graphics mode script as root, then run the main script as the normal user.
python3 /home/rich/aws-dash/gfxmode.py /dev/tty1 graphics

# if using a virtualenv
sudo -u rich bash -c 'cd /home/rich/aws-dash && source env/bin/activate && python3 -m fb_dashboard'
If not using a virtual environment you replace the last line above with this:
# if not using a virtualenv
sudo -u rich bash -c 'cd /home/rich/aws-dash && python3 -m fb_dashboard'
Auto-screen on/off
For nighttime, I usually want these kinds of dashboards to turn off.
To shut down automatically and turn on at a certain time, you can use cron. Add these lines to your crontab:
# turn on at 6:30 AM
30 6 * * * vcgencmd display_power 1

# turn off at 10:00 PM
0 22 * * * vcgencmd display_power 0
Testing
I have also built in a test mode that doesn’t use a framebuffer, but instead writes to a PNG file named framebuffer.png. This can be used for testing on your non-linux machine or inside a desktop environment. You can also pass --exit to exit after one (complete) frame after all widgets have been rendered.
python3 -m fb_dashboard --no-framebufferFuture Enhancements
I may add some new widget types, such as a clock, and maybe some other system stats. Also looking at increasing refresh rates and implementing a more comprehensive refresh/threading system for concurrent updates. If you have any ideas, let me know!